Facebook’s Bigger Video View Issue
- Published in: Social Media
- Written by Allison Solberg
- Permalink

As most of you already know, Facebook recently admitted that they made a mistake. *insert gasp*
Yes, Facebook, the social media giant, has been misleading advertisers and incorrectly reporting video view data – over the years, Facebook has artificially inflated some video metrics by between 60% to 80%. Facebook outlined the discrepancy/mistake in an advertiser help center posting, also quoted below:
“Average Duration of Video Viewed is the total time spent watching your video divided by the number of views of your video for three or more seconds.
NOTE: We recently discovered a discrepancy between the definition of Average Duration of Video Viewed and its calculation.
We had previously *defined* the Average Duration of Video Viewed as “total time spent watching a video divided by the total number of people who have played the video.” But we erroneously had *calculated* the Average Duration of Video Viewed as “the total time spent watching a video divided by *only* the number of people who have viewed a video for three or more seconds.”
Average % of Video Viewed was also impacted since it used the Average Duration metric in its calculation so both metrics are being updated. Below are the new metrics that will replace the Average Duration of Video Viewed metric and the Average % of Video Viewed metric.
Video Average Watch Time: the total watch time for your video, divided by the total number of video plays. This includes plays that start automatically and on click. This will replace the Average Duration of Video Viewed metric.
Video Percentage Watched: reflects the percentage of your video somebody watches per session, averaged across all sessions of your video where the video auto-played or was clicked to play. This will replace the Average % Video Viewed metric.
The corrected metrics are now available in Ads Manager and data is available starting Aug 25th, 2016. Deprecation of the legacy metrics will happen in late Oct.
We apologize for the inconvenience and we hope that these new metrics, in addition to other video metrics available in reporting will help you better evaluate your ad performance.
*This does not affect ads billing in any way.*“
While this was definitely misleading and caused some difficult client conversations, the bigger issue still remains…
Why does Facebook count a three second video view as a form of engagement?
It’s far too short of a time period. In addition, counting 3 second video views as a form of engagement will always over inflate video metrics and overall engagement data.
Let me take you on my rant journey and thought process. Below are three points on why three-second video views, as a metric, can be misleading, and why you should stop counting them in your analysis.
Point 1:
If Facebook counts 3 second video views as a form of engagement, then why doesn’t an image impression count as an engagement as well?
In three seconds, a user can scroll through their News Feed and look at an image posted by a brand. In those three seconds looking at the image, they determine whether or not they’d like to engage with that update. As many social media marketers know, those engagements (reactions, comments, etc.) are factored into a post’s engagement rate, which helps determine the post’s success and effectiveness.
For a Facebook video, in three seconds a user could scroll past one in their News Feed and decide that they don’t care for the video or brand. Therefore, they don’t continue to watch or engage with it. But, according to Facebook, that still counts as an engagement.
Another scenario involves video auto play – all the videos posted to Facebook automatically play in a user’s News Feed as they’re scrolling, so even if a user isn’t paying attention to their News Feed and a video auto plays, that counts as a form of engagement, despite the user not really engaging with (or even noticing) the video at all.
So the question remains: How is a three-second video view any different than a post impression, besides how they’re currently reported on by Facebook?
Point 2:
By including 3 second video views as a form of engagement, video posts will always have an overinflated engagement rate compared to image posts.
To illustrate this, I’ve put together a couple of side-by-side comparisons below
(Note: these examples are for illustrative purposes only and do not reflect Oreo’s actual Facebook data)
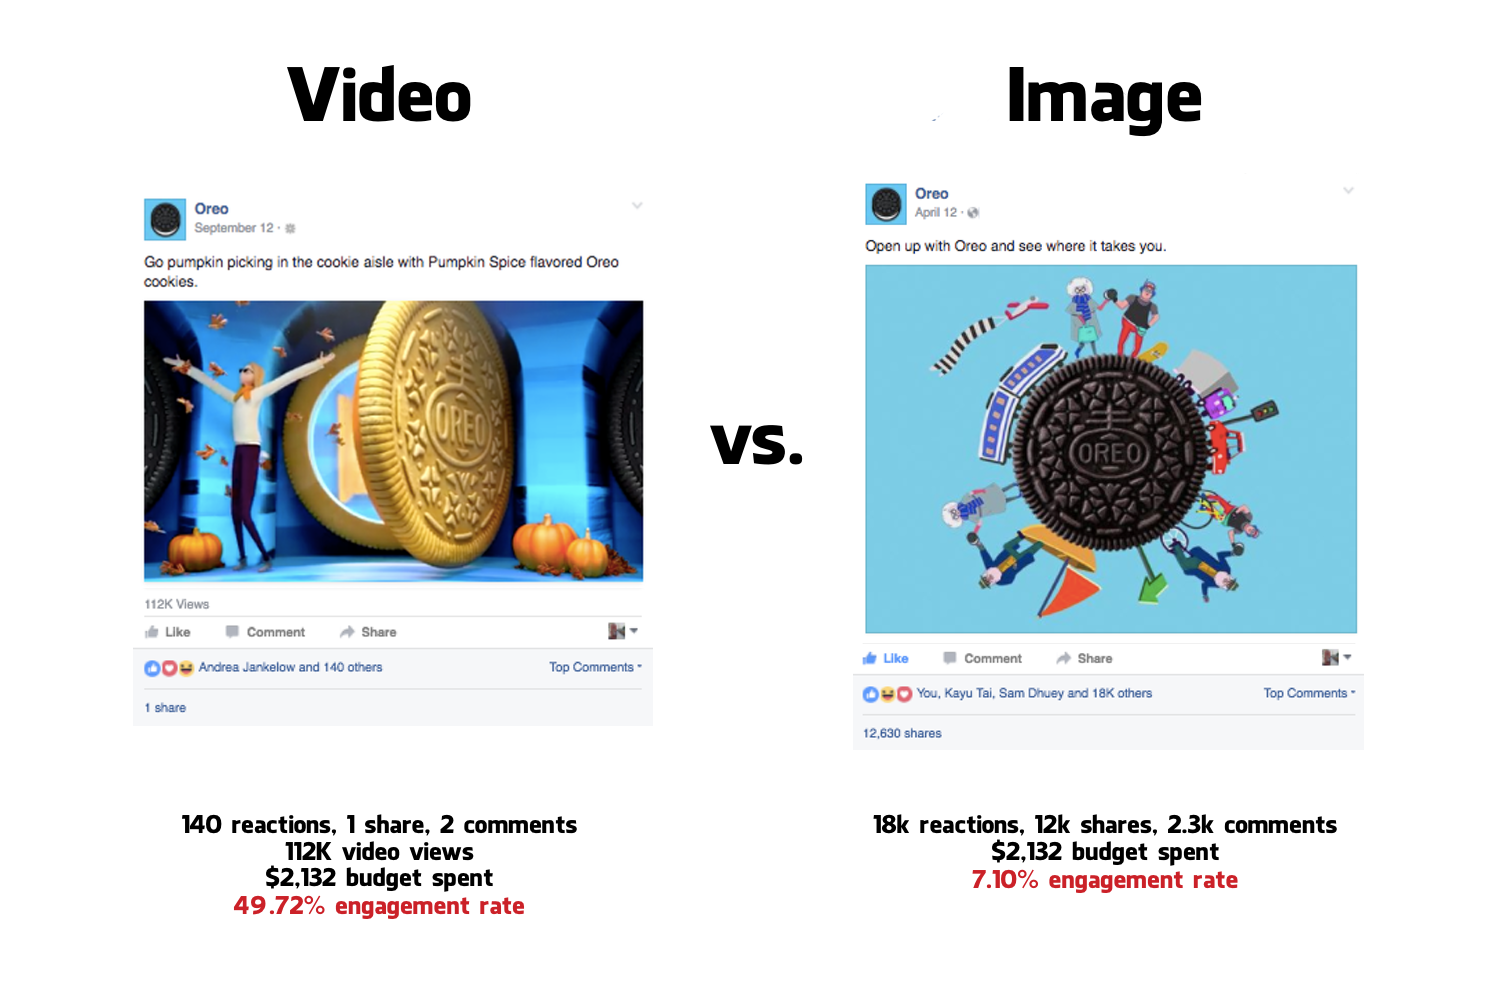
As you can see, by including three-second video views, the engagement rate is astronomically high compared to the image post’s engagement rate, which, at first glance, seems odd, considering the video received only 140 reactions and the image post received over 18k reactions.
Technically, it’s not an apples-to-apples comparison, since Facebook optimizes video ads to receive more three-second views, and image posts to receive more reactions and comments. But to Facebook, that’s fine since a three-second video view is an engagement to them.
Now, see what happens to the video’s engagement rate when we remove three-second views…
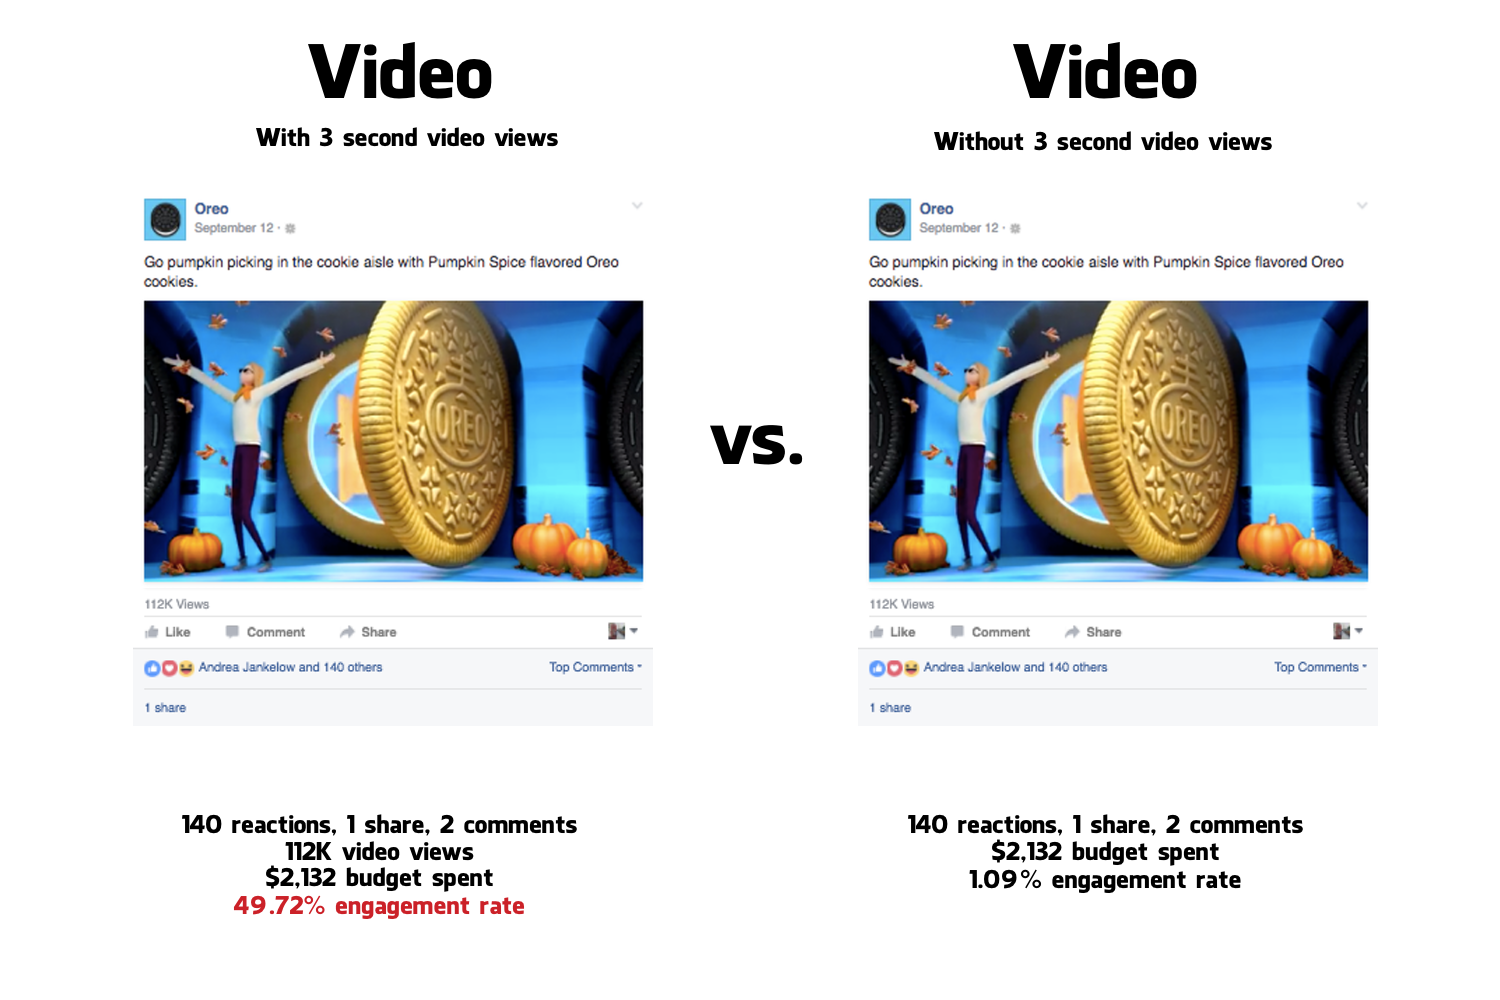 Well that’s confusing and misleading – one option suggests that the video performed amazingly well, and another says the video under-performed significantly. How is that beneficial for a brand’s social strategy?
Point 3:
If you include a 3 second video view as a form of engagement, then your data will primarily be dependent on how many videos you post each month and how much money supports them. (Hmmmm… maybe that’s why Facebook does it?)
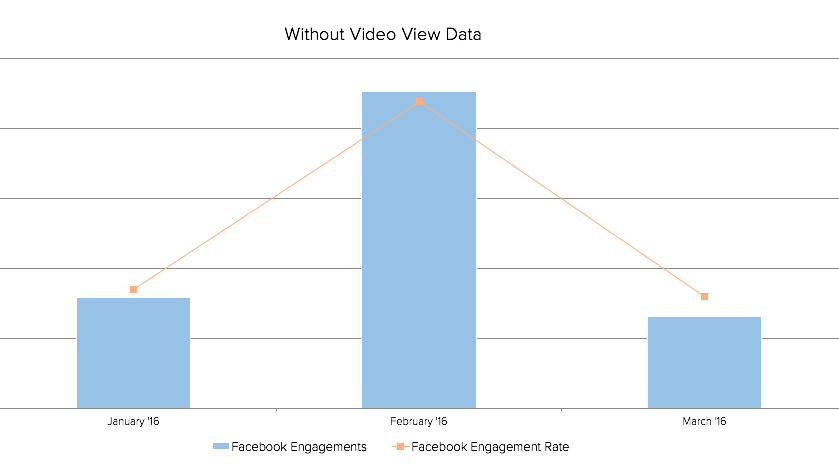
Take a look at the two different snapshots/graphs below – Graph A highlights how many total engagements a brand received without three-second video views as an engagement and Graph B includes them.
Graph A – Without 3 Second Video Views
Graph B – With 3 Second Video Views
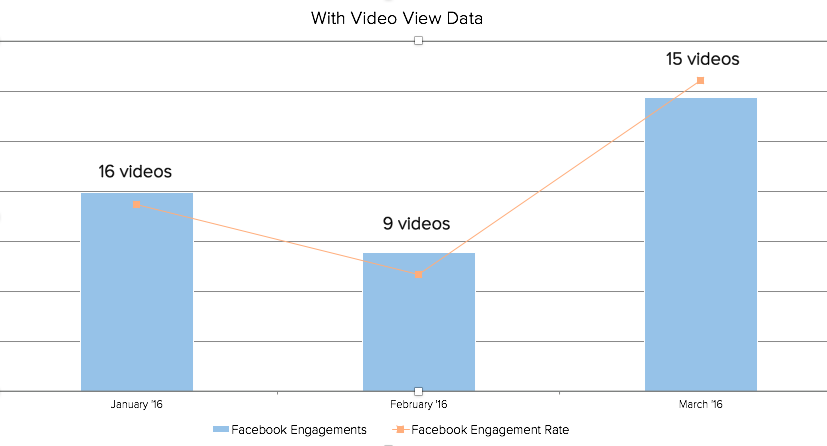
As you can see, each graph tells a completely different tale when it comes to results. You’ll notice in Graph C below that the majority of Graph B’s engagement data consists of three-second video views.
Graph C – 3 Second Video Views Highlighted in Orange
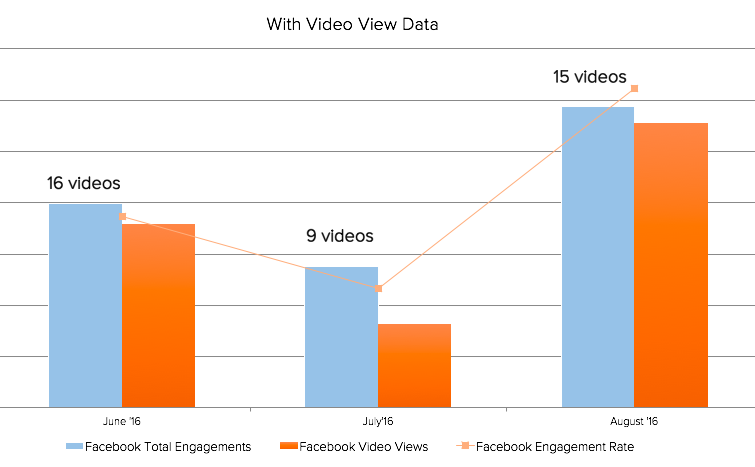
How does this data help brands determine what content works best on Facebook? In my opinion, it doesn’t, it only helps Facebook videos look amazing and helps agencies convince clients to invest more money in producing video. (Seems somewhat sleazy doesn’t it? Yes, I went there…)
So what should you do?
If you couldn’t guess by now, I would recommend not including three-second video views in your engagement data. I would remove this data from your total engagement metrics and report on video data separately.
Through Facebook Ads Manager, you can export 50% and 100% video view completions. I would recommend this as a more valuable route.
At the end of the day, your engagement data may see a dip – as outlined in “Point 3” – but you’ll be able to analyze your video’s performance more effectively.

